
Exploded axonometric diagram: what it is, and how to make one from a single photo
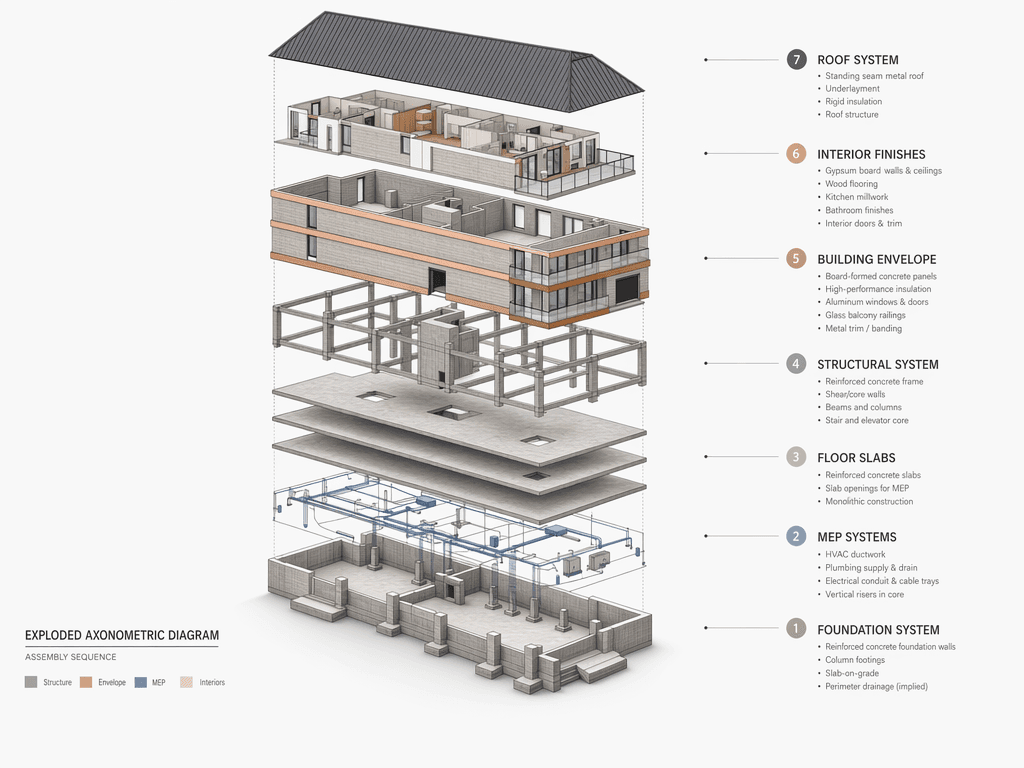
An exploded axonometric diagram takes a building apart along one axis so that its layers — foundation, structural frame, slabs, envelope, roof, interiors — float in order above each other, all drawn in the same measurable axonometric projection. It is the standard way to explain a construction system on a competition panel or in a studio review. The Exploded Diagram preset separates your building into foundation–structure–slab–wall–envelope–roof–interior layers and produces a construction diagram in true axonometric projection, at academic-publication quality. A ready-made image for a competition panel, project brief, or teaching material.
Why this preset
The construction-system drawing every competition panel needs — explained, then generated from an architectural photo or 3D render in about a minute
Explaining a building's structural system to a jury or student in a single image. It earns its place in scenarios like these:
- Construction narrative for an architecture competition panel
- A structural-system diagram in a project brief
- Teaching material — separating structural system / envelope / services
- An academic publication or book image
- Visually explaining cost line items to a client
How it works · 4 steps
The Exploded Diagram pipeline, step by step
The classic workflow means Manual vector drawing in Illustrator + color assignment + layer separation → 6-12 hours; with the Syntina Exploded Diagram preset it becomes One render + preset → ~60 seconds, axonometric projection generated automatically.
- 01
Prepare a reference image
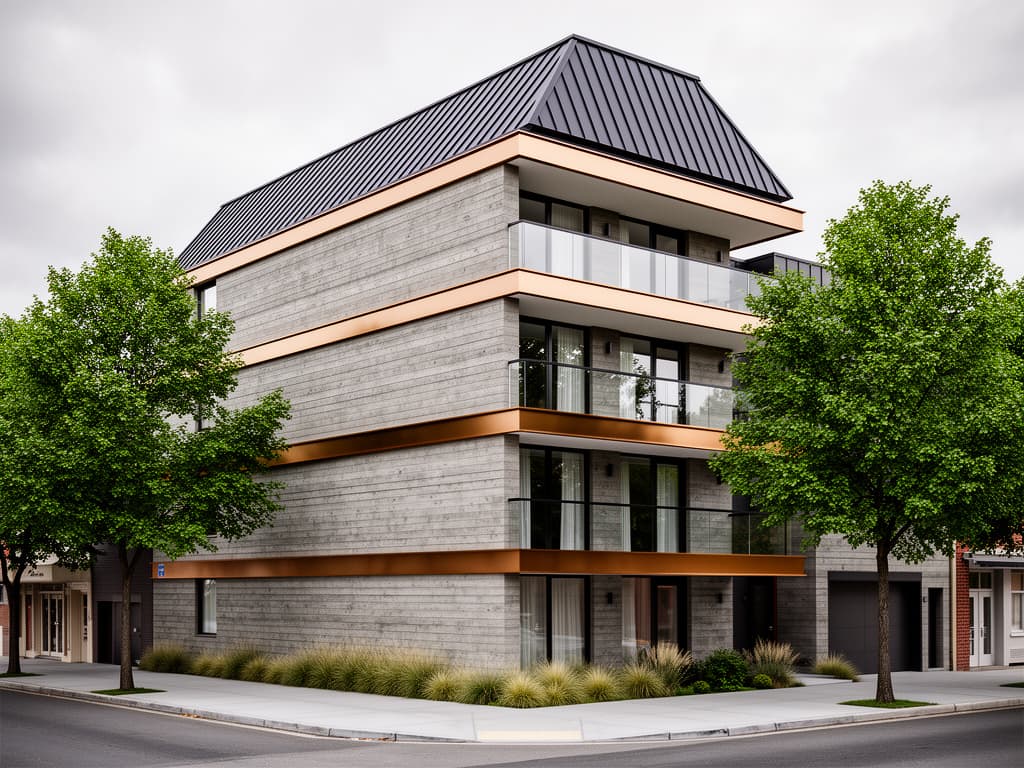
Upload an exterior photo or render of the building. A three-quarter perspective gives the best result — a 30-45 degree angle rather than a straight-on elevation.
- 02
Select the Exploded Diagram preset
Choose the preset from the panel. The perspective is automatically converted to an axonometric/isometric projection.
- 03
Specify layer priorities (optional)
Add notes to the prompt like 'emphasize MEP layer' or 'show structural grid clearly' to steer which layers get more visual detail.
- 04
Place the output on your panel or presentation
A publication-ready diagram is ready in seconds. The PDF, PNG, or vector-like WebP output drops straight into your panel template.
Tip · For very complex building geometries, use the preset on the main massing only, then add manual annotation afterward.
Tip · If you want to show the interior layer, include a section image in the input render as well.
Tip · You can customize the color coding to your office guidelines by adding a RAL/Pantone reference to the brief.
Limit · The preset doesn't perform real structural analysis — a column may not sit in the exact right place; this is a communication tool, not a detail-design document.
Limit · Single-story or flat-surfaced buildings may give the layer separation little to show; the preset is more effective on multi-story buildings.
Limit · The MEP (mechanical/electrical/plumbing) layer is generally stylized; produce it separately in CAD for full technical documentation.
AI models · 4 options
Which AI models does Exploded Diagram run on?
You can run the same preset on different models — economical ones for quick drafts, premium photorealism for client presentations. Model costs are charged as credits; the credit system page lists the equivalents.
- GPT Image 1.5 EditStandardDefaultFast, economical and consistent — the default for most presets.
- GPT Image 2 EditPremiumOpenAI's new generation — better understanding of long briefs.
- Nano Banana Pro EditPremiumPremium photorealism — presentation-grade architectural detail.
- FLUX 2 Flex EditStandardPrecise with materials and facade texture — strong in the architectural photo palette.
Frequently asked
What architects ask about Exploded Diagram
- What is an exploded axonometric diagram?
- It is an axonometric drawing in which the building's components are pulled apart along one axis (usually vertical) and held in their relative positions, so a viewer can see each layer — foundation, structure, floor slabs, envelope, roof, interior fit-out — and how they stack. Because the projection is axonometric rather than perspective, parallel edges stay parallel and dimensions stay comparable across layers. Architects use it to explain a construction system, a phasing sequence or a material strategy in a single image.
- How do you make an exploded axonometric drawing manually?
- The classic workflow: set an axonometric camera (30°/30° or 45°) in SketchUp, Rhino or Revit, group the model by layer (foundation, structure, slabs, envelope, roof, interiors), move each group upward by an equal offset, export line work, then finish line weights and colour coding in Illustrator. Budget 6-12 hours for a mid-size building, more if the model was not organised by layer. The Exploded Diagram preset skips the modelling and export steps: it reads the layers from an exterior photo or render and draws the exploded axonometric directly.
- Is the output vector or raster?
- The output is high-resolution raster (WebP/PNG). It holds up comfortably at A1 panel quality unless you scale it aggressively. If you need true vector, trace the output in Illustrator.
- What projection does it use?
- True axonometric (30°/30° dimetric) projection. There's no perspective distortion — a measurement stays equal on the horizontal and vertical axes. This is the standard for academic/competition panels.
- Is the layer count fixed?
- It comes out at 5-7 layers by default (foundation, structure, slabs, envelope, roof, interiors). Write 'combine slabs with structure' in the brief to reduce them, or 'separate MEP layer' to add more.
- How many credits does the preset use?
- Exploded Diagram uses 3 credits at its default setting. Producing 2-3 layer-emphasis alternatives of the same building for a competition (e.g. 'structural-system emphasis,' 'envelope emphasis') costs about 9 credits total.
- Can I use this on competition panels?
- Yes — the generated image is yours, and commercial and academic use is unrestricted. No attribution is required, but adding an 'AI-assisted' badge in a corner is a positive transparency signal if you want to introduce your office team to the Syntina pipeline.
- Can I get a section diagram of the same building too?
- Yes, the Section Drawing preset is a companion workflow — placing a section drawing next to the exploded diagram considerably strengthens your presentation.
Presets used together
Companions to the Exploded Diagram flow
3D View → Render
Turn a plain viewport capture from your modeling software into a photorealistic presentation render
Preset pagePreset · Floor Plan → 3DFloor Plan → 3D
From a CAD blueprint to a furnished, lit, and material-finished top-down render in a single step
Preset pagePreset · Add RealismAdd Realism
From the soft plastic look of a default render engine to a magazine-cover image in one step
Preset pageTry the Exploded Diagram preset for free
Generate your first render at no cost with the starter pack in the credit system.